Deploy Netflix Clone on Cloud with Jenkins: CI/CD, Security, and Scalability
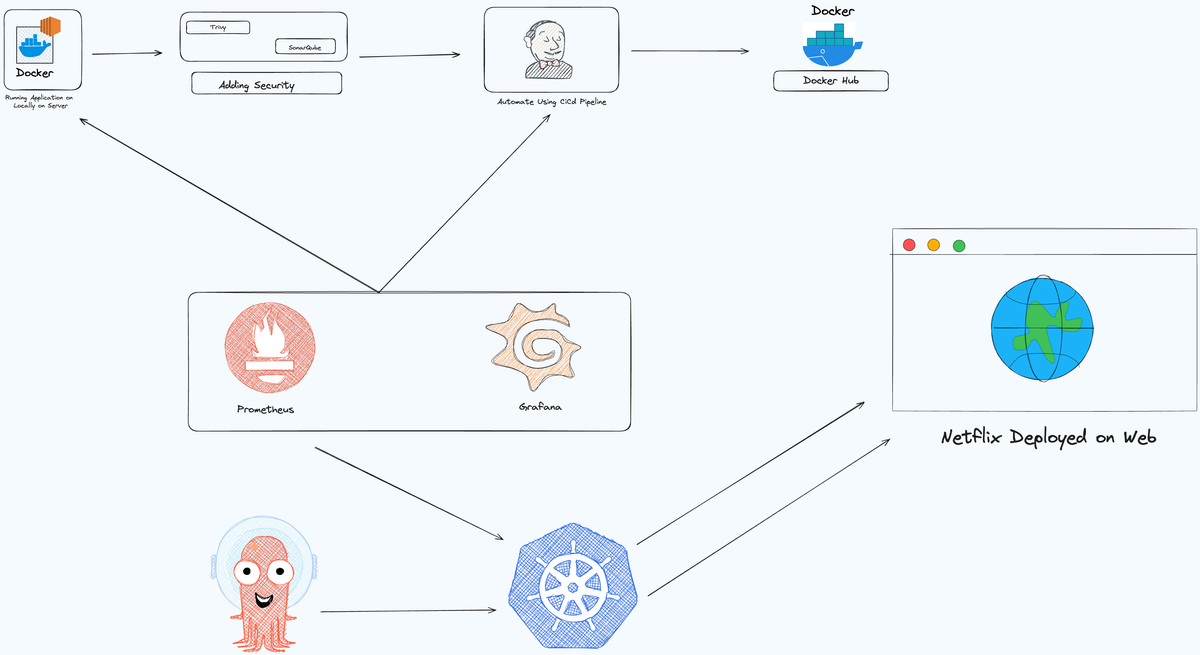
This guide will walk you through deploying a Netflix clone on the cloud with Jenkins. We’ll cover CI/CD pipeline setup, integrating security measures, and ensuring scalability for a robust deployment.
Prerequisites:
- AWS
- Kubernetes
- Gitops
- Prometheus
- Grafana
- Docker
- Jenkins
- awscli
Here I have provided step by step process for deploying the Netflix Clone application on Kubernetes using GitOps.
Phase 1: Initial Setup and Deployment
Step 1: Create an EC2 instance (Recommended t2.large). Remember to allow HTTP and HTTPS on the security firewall
Step 2: Attach an EIP (Elastic IP) and associate or attach the EIP with the Instance that we created
Step 3: Connect the Instance with ec2 connect or with any other terminal of your choice.
Update and Upgrade the Packages.
sudo apt update && sudo apt upgradeInstall Docker
sudo apt-get update
sudo apt-get install docker.io -y
sudo usermod -aG docker $USER  # Replace with your system's username, e.g., 'ubuntu'
newgrp docker
sudo chmod 777 /var/run/docker.sock
Build and run your application using Docker containers
docker build -t netflix .
docker run -d --name netflix -p 8081:80 netflix:latest

#to delete
docker stop <containerid>
docker rmi -f netflix
Step 4: Generate the API for the Netflix on TMDB
Create a new user to get a username https://www.themoviedb.org/signup
Profile -> Settings -> API Key (Request the API key
Step 5: Clone the Application from the GitHub.
git clone https://github.com/Arya-0011/DevSecOps-Netflix-Clone.gitStep 6: Run the application on the server using the docker.
cd DevSecOps-Netflix-Clonedocker build --build-arg TMDB_V3_API_KEY=<your-api-key> -t netflix .Note: Open the security Firewall port from security group 8081
Phase 2: Security
Installing SonarQube
Install SonarQube using Docker
docker run -d --name sonar -p 9000:9000 sonarqube:lts-communityNote: Open the security Firewall port from security group 9090
Installing Trivy
Install Trivy using apt manager on the same server
sudo apt-get install wget apt-transport-https gnupg lsb-release
wget -qO - https://aquasecurity.github.io/trivy-repo/deb/public.key | sudo apt-key add -
echo deb https://aquasecurity.github.io/trivy-repo/deb $(lsb_release -sc) main | sudo tee -a /etc/apt/sources.list.d/trivy.list
sudo apt-get update
sudo apt-get install trivy
trivy versiontrivy fs .docker imagesCopy the ID of docker image and run this command
trivy image 6a826dc25b30Phase 3: CI/CD Setup
Install Jenkins for Automation
Install Jenkins on the EC2 instance to automate deployment: Install Java
sudo apt update
sudo apt install fontconfig openjdk-17-jre
java -version
openjdk version "17.0.8" 2023-07-18
OpenJDK Runtime Environment (build 17.0.8+7-Debian-1deb12u1)
OpenJDK 64-Bit Server VM (build 17.0.8+7-Debian-1deb12u1, mixed mode, sharing)

#jenkins
sudo wget -O /usr/share/keyrings/jenkins-keyring.asc \
https://pkg.jenkins.io/debian-stable/jenkins.io-2023.key
echo deb [signed-by=/usr/share/keyrings/jenkins-keyring.asc] \
https://pkg.jenkins.io/debian-stable binary/ | sudo tee \
/etc/apt/sources.list.d/jenkins.list > /dev/null
sudo apt-get update
sudo apt-get install jenkins
sudo systemctl start jenkins
sudo systemctl enable jenkins
Access Jenkins in a web browser using the public IP of your EC2 instance. publicIp:8080
Install Necessary Plugins in Jenkins:
Goto Manage Jenkins →Plugins → Available Plugins →
Install below plugins
1 Eclipse Temurin Installer (Install without restart)
2 SonarQube Scanner (Install without restart)
3 NodeJs Plugin (Install Without restart)
4 Email Extension Plugin
Inisiatialization and setting up the Jenkins
Goto Manage Jenkins → Tools →
For Setting up the jdk17
- Search for “JDK installations”
- Name → jdk17
- Select the automatic Instalation
- Choose the server as 17.0.8.1+1
For setting up the NodeJS
- Seach for “NodeJS installations”
- Name → node16
- Select the automatic Instalation
- Choose the version as NodeJS 16.2.0
Integration of Sonarqube and Jenkins
- Goto the sonarqube dashboard <instance-ip>:9000
- Goto the Adminitrator Tab
- Select the securiy from the topbar and choose user
- Choose this option
- Create a username and click on generate
- Then copy that token
- Come back to jenkins Manage Jenkins → Crendentials → System → Global Crendentials → Add Credentials
- Select kind → Secret text
- Paste the token into Secret field (Which we copied from the sonarqube)
- Give the ID and Description to that token (I have chosen sonar-token)
- Come back to jenkins Manage Jenkins → Sytem and search for SonarQube servers
- Name → sonar-server
- URL → The base URL of the sonarqube server “http://<your instance Ip>:9000/”
- For the Server authentication token, select the sonar-token
- Click on apply and then save
For setting up the Sonarqube scanner
- Goto to jenkins, Manage Jenkins → Tools
- Search for SonarQube Scanner
- Name → sonar-scanner
- Select on Install Automatically
- Choose the source from “Install from Maven Central”
- Version 5.0.1.3006
- Click on applu and then Save
Creating A pipeline
- Goto the Jenkins Dashboard → Select New Item
- Name → Netflix
- Choose Pipeline option
- Then select pipeline from the left sidebar
- Scroll to the bottom
- In the Pipeline Section add the groovy script (Either you can write your own or you can use mine).
pipeline {
    agent any
    tools {
        jdk 'jdk17'
        nodejs 'node16'
    }
    environment {
        SCANNER_HOME = tool 'sonar-scanner'
    }
    stages {
        stage('clean workspace') {
            steps {
                cleanWs()
            }
        }
        stage('Checkout from Git') {
            steps {
                git branch: 'main', url: 'https://github.com/N4si/DevSecOps-Project.git'
            }
        }
        stage("Sonarqube Analysis") {
            steps {
                withSonarQubeEnv('sonar-server') {
                    sh '''$SCANNER_HOME/bin/sonar-scanner -Dsonar.projectName=Netflix \
                    -Dsonar.projectKey=Netflix'''
                }
            }
        }
        stage("quality gate") {
            steps {
                script {
                    waitForQualityGate abortPipeline: false, credentialsId: 'Sonar-token'
                }
            }
        }
        stage('Install Dependencies') {
            steps {
                sh "npm install"
            }
        }
    }
}- Then click on apply and then save
Setting up OWASP and Docker On Jenkins Just Like We did with Other Jenkins Plugins
Install Some plugins
- OWASP Dependency-Check
- Docker
- Docker Commons
- Docker Pipeline
- Docker API
- docker-build-steps
Add Docker Credentials in the jenkins
- Jenkins Manage Jenkins → Crendentials → System → Global Crendentials → Add Credentials
- Select Username With Password
- Add Docker Username and Password
- Give the Credential a ID
Setup the Dependecy check Tools on Jenkins Tools
- Goto Manage Jenkins → Tools
- Search for Dependency-Check Installations
- Name → DP-Check
- Add Installer → From gituhub.com (Version 8.4.0)
Setup the Docker on Jenkins Tools
- Name → docker
- Add Installer → From docker.com
- Version Latest
- Apply and Save
Now We can Add pipeline includes docker and dependency check and also trivy for scanning images
pipeline{
    agent any
    tools{
        jdk 'jdk17'
        nodejs 'node16'
    }
    environment {
        SCANNER_HOME=tool 'sonar-scanner'
    }
    stages {
        stage('clean workspace'){
            steps{
                cleanWs()
            }
        }
        stage('Checkout from Git'){
            steps{
                git branch: 'main', url: 'https://github.com/N4si/DevSecOps-Project.git'
            }
        }
        stage("Sonarqube Analysis "){
            steps{
                withSonarQubeEnv('sonar-server') {
                    sh ''' $SCANNER_HOME/bin/sonar-scanner -Dsonar.projectName=Netflix \
                    -Dsonar.projectKey=Netflix '''
                }
            }
        }
        stage("quality gate"){
           steps {
                script {
                    waitForQualityGate abortPipeline: false, credentialsId: 'Sonar-token'
                }
            }
        }
        stage('Install Dependencies') {
            steps {
                sh "npm install"
            }
        }
        stage('OWASP FS SCAN') {
            steps {
                dependencyCheck additionalArguments: '--scan ./ --disableYarnAudit --disableNodeAudit', odcInstallation: 'DP-Check'
                dependencyCheckPublisher pattern: '**/dependency-check-report.xml'
            }
        }
        stage('TRIVY FS SCAN') {
            steps {
                sh "trivy fs . > trivyfs.txt"
            }
        }
        stage("Docker Build & Push"){
            steps{
                script{
                   withDockerRegistry(credentialsId: 'docker', toolName: 'docker'){
                       sh "docker build --build-arg TMDB_V3_API_KEY=<yourapikey> -t netflix ."
                       sh "docker tag netflix nasi101/netflix:latest "
                       sh "docker push nasi101/netflix:latest "
                    }
                }
            }
        }
        stage("TRIVY"){
            steps{
                sh "trivy image nasi101/netflix:latest > trivyimage.txt"
            }
        }
        stage('Deploy to container'){
            steps{
                sh 'docker run -d -p 8081:80 nasi101/netflix:latest'
            }
        }
    }
}
If you get docker login failed errorr
sudo su
sudo usermod -aG docker jenkins
sudo systemctl restart jenkins
Phase 4: Monitoring Setup
I have already Made an post about the Prometheus and Grafana But I will add here too
Install Prometheus and Grafana:
Set up Prometheus and Grafana to monitor your application.
Insalling Prometheus
First, create a dedicated Linux user for Prometheus and download Prometheus:
sudo useradd --system --no-create-home --shell /bin/false prometheus
wget https://github.com/prometheus/prometheus/releases/download/v2.47.1/prometheus-2.47.1.linux-amd64.tar.gz
Extract Prometheus files, move them, and create directories:
tar -xvf prometheus-2.47.1.linux-amd64.tar.gz
cd prometheus-2.47.1.linux-amd64/
sudo mkdir -p /data /etc/prometheus
sudo mv prometheus promtool /usr/local/bin/
sudo mv consoles/ console_libraries/ /etc/prometheus/
sudo mv prometheus.yml /etc/prometheus/prometheus.yml
Set ownership for directories:
sudo chown -R prometheus:prometheus /etc/prometheus/ /data/Create a systemd unit configuration file for Prometheus:
sudo nano /etc/systemd/system/prometheus.serviceAdd the following content to the prometheus.service file:
[Unit]
Description=Prometheus
Wants=network-online.target
After=network-online.target

StartLimitIntervalSec=500
StartLimitBurst=5

[Service]
User=prometheus
Group=prometheus
Type=simple
Restart=on-failure
RestartSec=5s
ExecStart=/usr/local/bin/prometheus \
  --config.file=/etc/prometheus/prometheus.yml \
  --storage.tsdb.path=/data \
  --web.console.templates=/etc/prometheus/consoles \
  --web.console.libraries=/etc/prometheus/console_libraries \
  --web.listen-address=0.0.0.0:9090 \
  --web.enable-lifecycle

[Install]
WantedBy=multi-user.target
Here’s a brief explanation of the key parts in this prometheus.service file:
UserandGroupspecify the Linux user and group under which Prometheus will run.ExecStartis where you specify the Prometheus binary path, the location of the configuration file (prometheus.yml), the storage directory, and other settings.web.listen-addressconfigures Prometheus to listen on all network interfaces on port 9090.web.enable-lifecycleallows for management of Prometheus through API calls.
Enable and start Prometheus:
sudo systemctl enable prometheus
sudo systemctl start prometheus
Verify Prometheus’s status:
sudo systemctl status prometheusYou can access Prometheus in a web browser using your server’s IP and port 9090:
http://<your-server-ip>:9090Installing Node Exporter:
Create a system user for Node Exporter and download Node Exporter:
sudo useradd --system --no-create-home --shell /bin/false node_exporter
wget https://github.com/prometheus/node_exporter/releases/download/v1.6.1/node_exporter-1.6.1.linux-amd64.tar.gz
Extract Node Exporter files, move the binary, and clean up:
tar -xvf node_exporter-1.6.1.linux-amd64.tar.gz
sudo mv node_exporter-1.6.1.linux-amd64/node_exporter /usr/local/bin/
rm -rf node_exporter*
Create a systemd unit configuration file for Node Exporter:
sudo nano /etc/systemd/system/node_exporter.serviceAdd the following content to the node_exporter.service file:
[Unit]
Description=Node Exporter
Wants=network-online.target
After=network-online.target

StartLimitIntervalSec=500
StartLimitBurst=5

[Service]
User=node_exporter
Group=node_exporter
Type=simple
Restart=on-failure
RestartSec=5s
ExecStart=/usr/local/bin/node_exporter --collector.logind

[Install]
WantedBy=multi-user.target
Replace --collector.logind with any additional flags as needed.
Enable and start Node Exporter:
sudo systemctl enable node_exporter
sudo systemctl start node_exporter
Verify the Node Exporter’s status:
sudo systemctl status node_exporterYou can access Node Exporter metrics in Prometheus.
Configure Prometheus Plugin Integration:
Integrate Jenkins with Prometheus to monitor the CI/CD pipeline.
Prometheus Configuration:
To configure Prometheus to scrape metrics from Node Exporter and Jenkins, you need to modify the prometheus.yml file. Here is an example prometheus.yml configuration for your setup:
global:
  scrape_interval: 15s

scrape_configs:
  - job_name: 'node_exporter'
    static_configs:
      - targets: ['localhost:9100']

  - job_name: 'jenkins'
    metrics_path: '/prometheus'
    static_configs:
      - targets: ['<your-jenkins-ip>:<your-jenkins-port>']
Make sure to replace <your-jenkins-ip> and <your-jenkins-port> with the appropriate values for your Jenkins setup.
Check the validity of the configuration file:
promtool check config /etc/prometheus/prometheus.ymlReload the Prometheus configuration without restarting:
curl -X POST http://localhost:9090/-/reloadYou can access Prometheus targets at:
http://<your-prometheus-ip>:9090/targetsGrafana
Install Grafana on Ubuntu 22.04 and Set it up to Work with Prometheus
Step 1: Install Dependencies:
First, ensure that all necessary dependencies are installed:
sudo apt-get update
sudo apt-get install -y apt-transport-https software-properties-common
Step 2: Add the GPG Key:
Add the GPG key for Grafana:
wget -q -O - https://packages.grafana.com/gpg.key | sudo apt-key add -Step 3: Add Grafana Repository:
Add the repository for Grafana stable releases:
echo "deb https://packages.grafana.com/oss/deb stable main" | sudo tee -a /etc/apt/sources.list.d/grafana.listStep 4: Update and Install Grafana:
Update the package list and install Grafana:
sudo apt-get update
sudo apt-get -y install grafana
Step 5: Enable and Start Grafana Service:
To automatically start Grafana after a reboot, enable the service:
sudo systemctl enable grafana-serverThen, start Grafana:
sudo systemctl start grafana-serverStep 6: Check Grafana Status:
Verify the status of the Grafana service to ensure it’s running correctly:
sudo systemctl status grafana-serverStep 7: Access Grafana Web Interface:
Open a web browser and navigate to Grafana using your server’s IP address. The default port for Grafana is 3000. For example:
http://<your-server-ip>:3000
You’ll be prompted to log in to Grafana. The default username is “admin,” and the default password is also “admin.”
Step 8: Change the Default Password:
When you log in for the first time, Grafana will prompt you to change the default password for security reasons. Follow the prompts to set a new password.
Step 9: Add Prometheus Data Source:
To visualize metrics, you need to add a data source. Follow these steps:
- Click on the gear icon (⚙️) in the left sidebar to open the “Configuration” menu.
- Select “Data Sources.”
- Click on the “Add data source” button.
- Choose “Prometheus” as the data source type.
- In the “HTTP” section:
- Set the “URL” to
http://localhost:9090(assuming Prometheus is running on the same server). - Click the “Save & Test” button to ensure the data source is working.
- Set the “URL” to
Step 10: Import a Dashboard:
To make it easier to view metrics, you can import a pre-configured dashboard. Follow these steps:
- Click on the “+” (plus) icon in the left sidebar to open the “Create” menu.
- Select “Dashboard.”
- Click on the “Import” dashboard option.
- Enter the dashboard code you want to import (e.g., code 1860).
- Click the “Load” button.
- Select the data source you added (Prometheus) from the dropdown.
- Click on the “Import” button.
You should now have a Grafana dashboard set up to visualize metrics from Prometheus.
Grafana is a powerful tool for creating visualizations and dashboards, and you can further customize it to suit your specific monitoring needs.
That’s it! You’ve successfully installed and set up Grafana to work with Prometheus for monitoring and visualization.
- Configure Prometheus Plugin Integration:
- Integrate Jenkins with Prometheus to monitor the CI/CD pipeline.
Phase 5: Notification
- Implement Notification Services:
- Set up email notifications in Jenkins or other notification mechanisms.
Adding Prometheus Plugin in Jenkins for monitoring the Jenkins through the Grafana
Goto Manage Jenkins →Plugins → Available Plugins → prometheus metrics
Install this plugin and restart the jenkiins
Then Go to the Prometheus server and add the jobs for the jenkins
I have added above how to add jenkins in promeheus YML File
Kubernetes (Deployinng on EKS Cluster)
- Go to AWS EKS Dashboard
- Select add cluster and then create
- Give a name and leave the version as it is
- Then amke a role for the EKS Cluster
- I have made this role for deploying the cluster
{
    "Version": "2012-10-17",
    "Statement": [
        {
            "Effect": "Allow",
            "Action": [
                "autoscaling:DescribeAutoScalingGroups",
                "autoscaling:UpdateAutoScalingGroup",
                "ec2:AttachVolume",
                "ec2:AuthorizeSecurityGroupIngress",
                "ec2:CreateRoute",
                "ec2:CreateSecurityGroup",
                "ec2:CreateTags",
                "ec2:CreateVolume",
                "ec2:DeleteRoute",
                "ec2:DeleteSecurityGroup",
                "ec2:DeleteVolume",
                "ec2:DescribeInstances",
                "ec2:DescribeRouteTables",
                "ec2:DescribeSecurityGroups",
                "ec2:DescribeSubnets",
                "ec2:DescribeVolumes",
                "ec2:DescribeVolumesModifications",
                "ec2:DescribeVpcs",
                "ec2:DescribeDhcpOptions",
                "ec2:DescribeNetworkInterfaces",
                "ec2:DescribeAvailabilityZones",
                "ec2:DetachVolume",
                "ec2:ModifyInstanceAttribute",
                "ec2:ModifyVolume",
                "ec2:RevokeSecurityGroupIngress",
                "ec2:DescribeAccountAttributes",
                "ec2:DescribeAddresses",
                "ec2:DescribeInternetGateways",
                "elasticloadbalancing:AddTags",
                "elasticloadbalancing:ApplySecurityGroupsToLoadBalancer",
                "elasticloadbalancing:AttachLoadBalancerToSubnets",
                "elasticloadbalancing:ConfigureHealthCheck",
                "elasticloadbalancing:CreateListener",
                "elasticloadbalancing:CreateLoadBalancer",
                "elasticloadbalancing:CreateLoadBalancerListeners",
                "elasticloadbalancing:CreateLoadBalancerPolicy",
                "elasticloadbalancing:CreateTargetGroup",
                "elasticloadbalancing:DeleteListener",
                "elasticloadbalancing:DeleteLoadBalancer",
                "elasticloadbalancing:DeleteLoadBalancerListeners",
                "elasticloadbalancing:DeleteTargetGroup",
                "elasticloadbalancing:DeregisterInstancesFromLoadBalancer",
                "elasticloadbalancing:DeregisterTargets",
                "elasticloadbalancing:DescribeListeners",
                "elasticloadbalancing:DescribeLoadBalancerAttributes",
                "elasticloadbalancing:DescribeLoadBalancerPolicies",
                "elasticloadbalancing:DescribeLoadBalancers",
                "elasticloadbalancing:DescribeTargetGroupAttributes",
                "elasticloadbalancing:DescribeTargetGroups",
                "elasticloadbalancing:DescribeTargetHealth",
                "elasticloadbalancing:DetachLoadBalancerFromSubnets",
                "elasticloadbalancing:ModifyListener",
                "elasticloadbalancing:ModifyLoadBalancerAttributes",
                "elasticloadbalancing:ModifyTargetGroup",
                "elasticloadbalancing:ModifyTargetGroupAttributes",
                "elasticloadbalancing:RegisterInstancesWithLoadBalancer",
                "elasticloadbalancing:RegisterTargets",
                "elasticloadbalancing:SetLoadBalancerPoliciesForBackendServer",
                "elasticloadbalancing:SetLoadBalancerPoliciesOfListener",
                "kms:DescribeKey"
            ],
            "Resource": "*"
        },
        {
            "Effect": "Allow",
            "Action": "iam:CreateServiceLinkedRole",
            "Resource": "*",
            "Condition": {
                "StringEquals": {
                    "iam:AWSServiceName": "elasticloadbalancing.amazonaws.com"
                }
            }
        }
    ]
}- Click Next
- Choose VPC as the default one
- Select the subnet you can choose the default one or you can create your own
- You can choose the default securoty group or the same security group we are using for the jenkins server
- Cluster endpoint access -> Public
- Click Next
- Again Click Next
- Go with the default Add Ons
- Click on Next
- And Now Click on Crete
Note It can take some time to create Clusters
After the Cluster create nodes
Go To The Cluster that we just crated
- Select the “Add Node Group”
- Name the node group
- Attach an IAM Role into it
- Click Next
- Choose the AMI Type or leave the default one
- Capacity Type “On-Demand”
- Instance Type t3.medium
- Desired: 1
- Minimum: 1
- Maxumum: 1
- Node Group Update Configuration Number -> “Value => 1”
- Click Next
- Leave the Subnets as default
- Click Next
- Click Create
Prepare the Kubernetes for deploying the application on aws
Install awscli (Depending upon the OS. I am using MACos)
Then Run this command to generate the layout
Monitor Kubernetes with Prometheus
Prometheus is a powerful monitoring and alerting toolkit, and you’ll use it to monitor your Kubernetes cluster. Additionally, you’ll install the node exporter using Helm to collect metrics from your cluster nodes.
Install Node Exporter using Helm
To begin monitoring your Kubernetes cluster, you’ll install the Prometheus Node Exporter. This component allows you to collect system-level metrics from your cluster nodes. Here are the steps to install the Node Exporter using Helm:
- Add the Prometheus Community Helm repository:helm repo add prometheus-community https://prometheus-community.github.io/helm-charts
- Create a Kubernetes namespace for the Node Exporter:kubectl create namespace prometheus-node-exporter
- Install the Node Exporter using Helm:helm install prometheus-node-exporter prometheus-community/prometheus-node-exporter –namespace prometheus-node-exporter
Add a Job to Scrape Metrics on nodeip:9001/metrics in prometheus.yml:
Update your Prometheus configuration (prometheus.yml) to add a new job for scraping metrics from nodeip:9001/metrics. You can do this by adding the following configuration to your prometheus.yml file:
  - job_name: 'Netflix'
    metrics_path: '/metrics'
    static_configs:
      - targets: ['node1Ip:9100']
Replace ‘your-job-name’ with a descriptive name for your job. The static_configs section specifies the targets to scrape metrics from, and in this case, it’s set to nodeip:9001.
Don’t forget to reload or restart Prometheus to apply these changes to your configuration.
To deploy an application with ArgoCD, you can follow these steps, which I’ll outline in Markdown format:
Deploy Application with ArgoCD
- Install ArgoCD:You can install ArgoCD on your Kubernetes cluster by following the instructions provided in the EKS Workshop documentation.
- Set Your GitHub Repository as a Source:After installing ArgoCD, you need to set up your GitHub repository as a source for your application deployment. This typically involves configuring the connection to your repository and defining the source for your ArgoCD application. The specific steps will depend on your setup and requirements.
- Create an ArgoCD Application:
name: Set the name for your application.destination: Define the destination where your application should be deployed.project: Specify the project the application belongs to.source: Set the source of your application, including the GitHub repository URL, revision, and the path to the application within the repository.syncPolicy: Configure the sync policy, including automatic syncing, pruning, and self-healing.
- Access your Application
- To Access the app make sure port 30007 is open in your security group and then open a new tab paste your NodeIP:30007, your app should be running.
Phase 7: Cleanup
- Cleanup AWS EC2 Instances:
- Terminate AWS EC2 instances that are no longer needed.