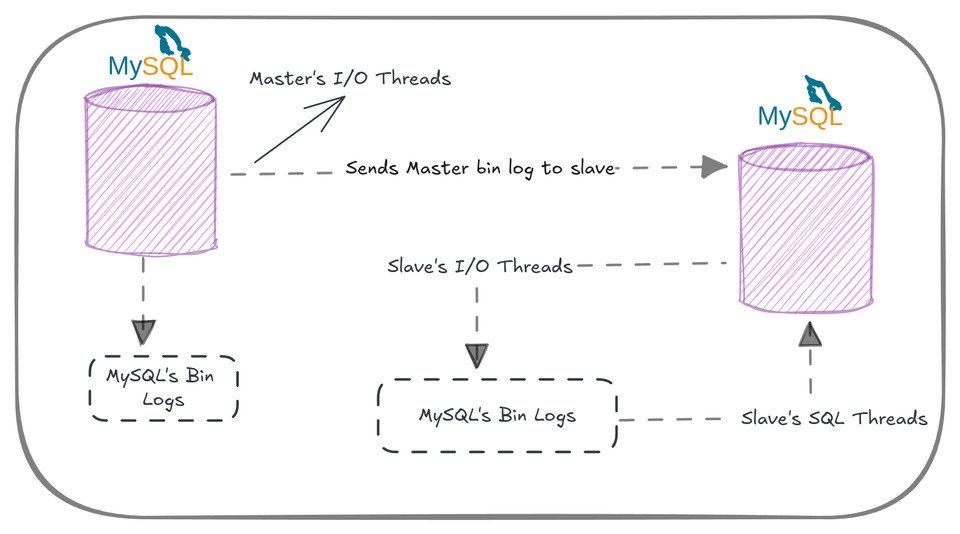
Comprehensive Guide to Monitoring MySQL Master-Slave Replication Setup
Learn how to effectively monitor MySQL Master-Slave replication setup with essential tools and techniques. Ensure seamless performance and detect replication issues in real-time.

In this guide, we'll explore the key tools and strategies to monitor your MySQL Master-Slave replication setup. From tracking replication health to detecting latency issues, this tutorial will help you keep your database running smoothly and efficiently.
In this tutorial, we will walk you through setting up monitoring for a MySQL Master-Slave replication setup using Percona Monitoring and Management (PMM). PMM is a powerful, open-source tool that allows you to monitor, manage, and optimize database performance across MySQL, PostgreSQL, and MongoDB. This guide will help you install PMM, configure it to monitor your MySQL replication setup, and utilize its powerful analytics to ensure your databases perform at their best.
If want to know how to setup the Master-Slave Replication Setup
Prerequisites:
- A running MySQL Master-Slave replication setup
- Access to both Master and Slave MySQL servers
- Basic knowledge of MySQL queries
- Access to install software on the server where PMM will run
- Docker need to be installed on the server on the centralised monitoring server
Deploy an instance or VPS.
- This will be our central server for monitoring the service.
- Install Docker on this system
sudo apt install docker.ioRun the following command to install the PMM server:
curl -fsSL https://www.percona.com/get/pmm | /bin/bashThis script will automatically install the required components and set up the PMM server.
After installation, you will see instructions to access the PMM web interface, including the default login credentials. Make sure to note the URL and login information.
The default Username and Password is admin and admin
- Check your Dashboard at the configured domain or the instance IPs
Install PMM Client on Master and Slave instances.
- Install the PMM client on both your master and slave MySQL instances.
Run the following command to install the Percona repository on each machine you want to monitor (both master and slave):
sudo apt-get install gnupg2 curl
curl -fsSL https://repo.percona.com/apt/percona-release_latest.$(lsb_release -sc)_all.deb -o percona-release_latest.$(lsb_release -sc)_all.deb
sudo dpkg -i percona-release_latest.$(lsb_release -sc)_all.deb
sudo apt-get update
- Install the PMM Client on both instances
Once the repository is added, install the PMM client by running the following command:
sudo apt-get install pmm2-client
- Connect PMM Client to the PMM Server.
After the client is installed, connect each server (both master and slave) to your PMM server. Run the following command on each machine:
sudo pmm-admin config --server-insecure-tls --server-url=https://admin:<password>@pmm.example.com- Replace
<password>with the password for the PMM server. - Replace
pmm.example.comwith the URL or IP address of your PMM server.
Note: When the URL contains the username and password, the @ symbol is used to separate the credentials from the server address. However, your password also contains an @ symbol (Hello@123), which is confusing the system when parsing the URL.
sudo pmm-admin config --server-insecure-tls --server-url=https://admin:hello%40123@5.78.122.171/
Create a PMM Monitoring User in MySQL on Both Master and Slave
- In MySQL
mysql
CREATE USER 'pmm'@'localhost' IDENTIFIED BY 'pass' WITH MAX_USER_CONNECTIONS 10;
GRANT SELECT, PROCESS, SUPER, REPLICATION CLIENT, RELOAD, BACKUP_ADMIN ON *.* TO 'pmm'@'localhost';
- In MariaDB
mysql
CREATE USER 'pmm'@'localhost' IDENTIFIED BY 'pass' WITH MAX_USER_CONNECTIONS 10;
GRANT SELECT, PROCESS, SUPER, REPLICATION CLIENT, RELOAD ON *.* TO 'pmm'@'localhost';
Register MySQL for Monitoring:
sudo pmm-admin add mysql --username=pmm --password=pass --query-source=perfschema
Fine Tuning Mysql
- Enable Slow Query Log
- Method 1: Configuration File
Edit the MySQL Configuration File Open the MySQL configuration file (usually located at /etc/mysql/my.cnf or /etc/my.cnf).
sudo nano /etc/mysql/my.cnfAdd/Modify the Following Settings
[mysqld]
slow_query_log=ON
log_output=FILE
long_query_time=0
log_slow_admin_statements=ON
log_slow_slave_statements=ON
Save and Exit
If you are using nano, you can save by pressing CTRL + X, then Y, and ENTER.
Restart MySQL Service
sudo systemctl restart mysql- Method 2: Run SQL Commands
If you want to enable the slow query log temporarily (until the next restart), you can run the following SQL commands in the MySQL shell:
Log into MySQL
mysqlRun the Following Commands
SET GLOBAL slow_query_log = 'ON';
SET GLOBAL log_output = 'FILE';
SET GLOBAL long_query_time = 0;
SET GLOBAL log_slow_admin_statements = 'ON';
SET GLOBAL log_slow_slave_statements = 'ON';
EXIT;
- Configure PMM to Use Slow Query Log
Once the slow query log is enabled, you need to ensure that the PMM client is configured to use it as a source of metrics.
- Add MySQL Monitoring with PMM Client
If you haven't already done so, run the command to add the MySQL instance to PMM monitoring:
sudo pmm-admin add mysql --username=pmm --password=pass --query-source=slowlog- Ensure to replace
passwith the actual password for thepmmuser. - If you monitor both master and slave, run this command on both nodes, ensuring they are configured to use the slow query log.
For the Slave Logs and the legacy hit this query to check the dashboard.
<domain/Ip>/graph/d/mysql-replicaset-summary/mysql-replication-summary?orgId=1&refresh=1m
The Percona Queries is based on the PromQL (Prometheus Query Language). Based on that you add add the Alerts as well for the notification on your Slack or Any Collaboration tools. Grafana Support is also there.